Promoting Responsible Consumption and Production of One of Earth’s Most Precious Resources
Introduction
Project Name:
Every Drop Counts
Project Date:
November 2024 – February 2025
Tools Used:
Figma
My Role:
This project was developed as part of an instructor-guided UX Design course, where I was responsible for the entire UX process, including research, strategy, design, prototyping, and user testing.
Objective:
Design a mobile app that helps users track and reduce water consumption through personalized insights and actionable recommendations. The goal is to make sustainability engaging and easy to incorporate into daily life.
Challenge
Many users are unaware of how much water they consume daily and lack clear guidance on how to reduce waste efficiently. The challenge was to design an intuitive interface that:
- Educates users on water conservation without overwhelming them.
- Provides personalized tracking and actionable steps.
- Keeps users engaged through progress visualization.
Research
Competitive Analysis
Analyzed sustainability and utility tracking apps to identify best practices and improvement areas.
Key takeaways:
- Simple UI with data visualizations improves user retention.
- Personalized goals keep users engaged.
- Many apps lacked actionable steps beyond tracking data.
User Surveys & Interviews
Conducted research with 16 participants including:
- Eco-conscious users looking to optimize water use.
- Families aiming to reduce utility costs.
- Casual users curious about their consumption habits.
Key Findings
- 88% of users didn’t know how much water they used monthly.
- 63% do not use another app to budget.
- 75% are motivated to save money on their water bill.
Solution
Key Features & Design Approach
- Daily Water Tracking: Users log water consumption by syncing with smart meters.
- Smart Insights: Personalized tips based on user habits.
- Progress Visualization: Simple, interactive graphs show consumption trends.
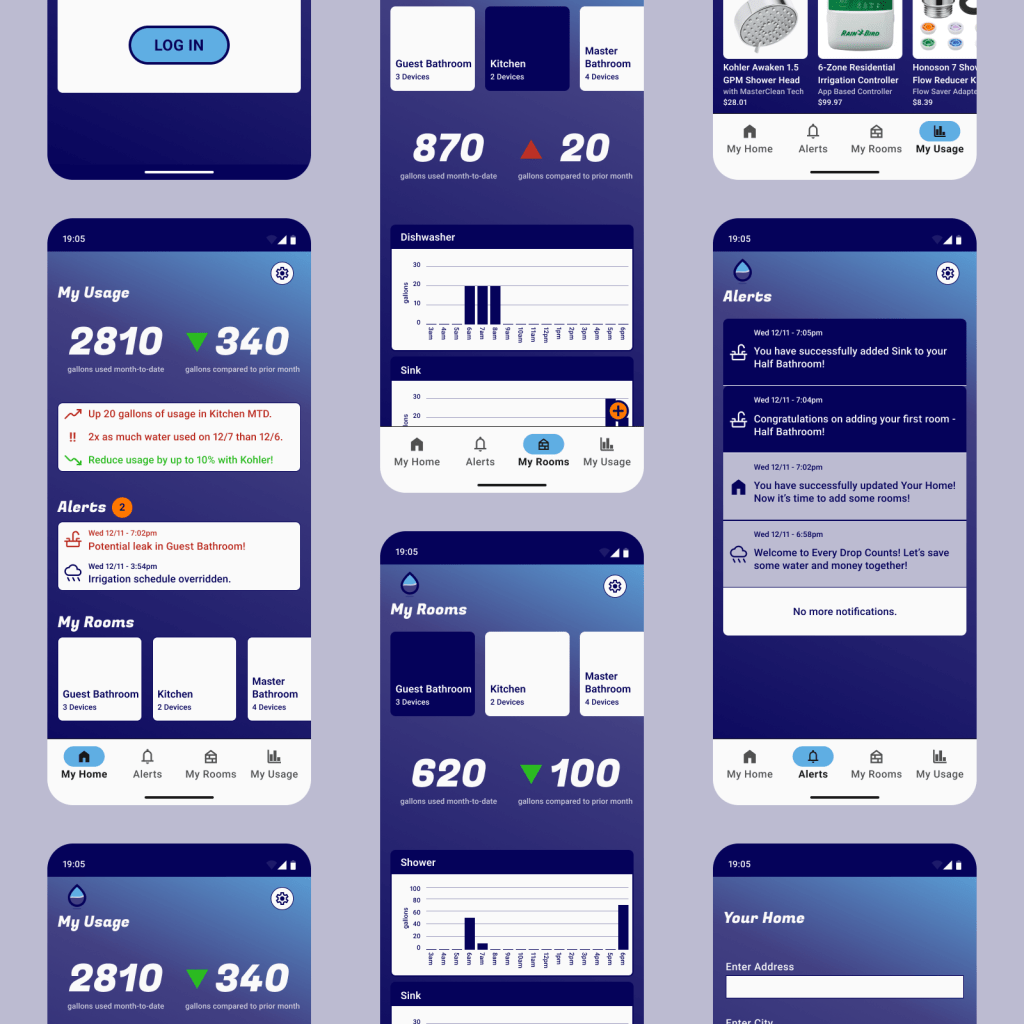
Design & Prototyping
The UI followed a clean, minimalistic approach to reduce cognitive load. Water usage was tracked using color-coded water consumption indicators (Green = efficient, Red = high usage) and microinteractions were integrated for a smooth, engaging user experience. The Stark plugin ensured compliance with WCAG standards.
Testing & Iterations
2 rounds of user testing was conducted with 6 participants. Improvements include bar chart visibility on My Rooms pages, screen transitions, and the addition of clickability on the My Usage page.
The prototype can be seen and interacted with here.
